How do we figure out our best actions…….. Transition Streets 5.1.1
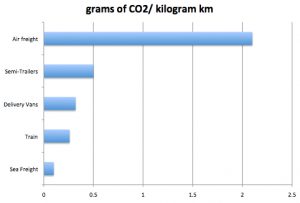
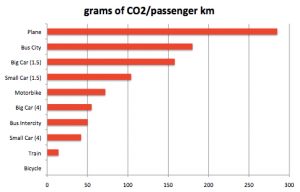
Working out your transport footprint is complex.
There is data on modes of transport defined in green house gas emissions, general pollution, and other health impacts. But we also need to consider the changes in these results when the number of passengers ( or the amount of freight ) is taken into account.
Starting with your own car use – the Australian Government Green Vehicle Guide – gives official testing data on cars registered in Australia. You can look up data by month and year, search for older cars, and put in your own data to calculate your CO2 footprint.
| 2020 top sellers | CO2/km | 2020 Top savers | CO2/km | |
| 1 Ford Ranger 4×4 | 220 | 1 Hyundai Ioniq Electric | 0 | |
| 2 Toyota RAV4 | 130 | 2 Hyundai Kona Electric | 0 | |
| 3 Toyota Hilux 4×4 | 230 | 3 Renault ZOE Electric | 0 | |
| 4 Toyota Corolla | 124 | 4 BMW i3 Electric | 0 | |
| 5 Hyundai i30 | 150 | 5 Renault Kangoo ZE Electric | 0 | |
| 6 Mazda CX-5 | 175 | 6 Tesla Model S Electric | 0 | |
| 7 Kia Cerato | 176 | 7 Nissan Leaf Electric | 0 | |
| 8 Mitsubishi Triton 4×4 | 218 | 8 Tesla Model 3 Electric | 0 | |
| 9 Toyota Prado | 238 | 9 Tesla Model X Electric | 0 | |
| 10 Mazda 3 | 150 | 10 Mercedes-Benz EQC Electric | 0 | |
| 11 Hyundai Tucson | 174 | 11 Jaguar I-Pace Electric | 0 | |
| 12 Nissan X-Trail | 165 | 12 Ford Escape Plug-in Hybrid | 33 | |
| 13 Mitsubishi ASX | 182 | 13 Audi A3 e-tron Plug-in Hybrid | 35 | |
| 14 Toyota Camry | 156 | 14 Mitsubishi Outlander PHEV | 43 | |
| 15 Mazda CX-3 | 140 | 15 Mercedes-Benz C300e PHEV | 46 | |
| 16 Toyota Landcruiser | 275 | 16 Volvo S60 T8 Plug-in Hybrid | 46 | |
| 17 Mitsubishi Outlander | 104 | 17 Volvo V60 T8 Plug-in Hybrid | 46 | |
| 18 Subaru Forester | 188 | 18 Audi Q7 e-tron Plug-in Hybrid | 49 | |
| 19 Volkswagen Golf | 146 | 19 Volvo XC90 T8 Plug-in Hybrid | 49 | |
| 20 Honda CR-V | 167 | 20 BMW 330e Plug-in Hybrid | 49 |